
A/B Testing for PM
Controlled Experiments, or more commonly known as A/B tests, allow product managers to demonstrate the impact of new features or changes on user experience. Running A/B tests is a way to make data-driven decisions that enhance customer experience, thus increasing retention and revenue.
What is A/B Testing?
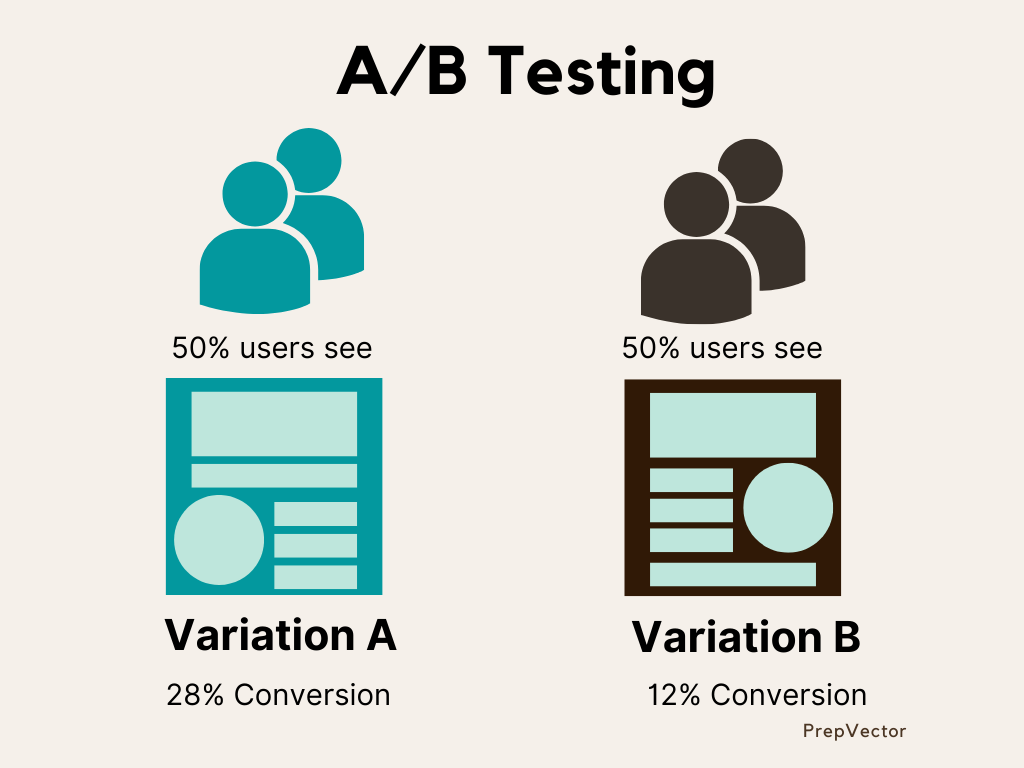
In its most simplest form, A/B Testing is a method of testing two variants (A and B) of a webpage, product design, layout etc. to compare the performance of the two variants and determine which one drives better results towards a chosen goal. The goal is a metric that we want to compare the two variants against - this can be page views, clicks, conversions, bounce rates etc. A sample of users is chosen at random and are divided equally among the two variants ie 50% of the traffic is directed to variant A and 50% is directed to variant B. Statistical methods are then used to compare the results from the two variants and determine the better performing variant.
Why A/B test?
A/B Testing has a wide variety of use-cases. It can be used to test landing pages, button colors and placements, feature improvements, recommendation algorithms, etc. It is a form of experimental design that is now the gold standard for objectively comparing variants and establishing causality. A/B tests help align teams on product features and designs through data-driven insights, and not depend on the ‘highest paid person’s opinion’ (HIPPO).
Additionally, A/B tests are a great way to quantify the impact of product changes and make objective decisions. A great experimentation culture aligns various teams towards common goals, and helps achieve those goals through rigorous testing. Experiments take the guesswork out of product optimization and enables a data-first culture. This ensures businesses transition from a ‘We think users will love this product’ to ‘We know users love this product’, thus ensuring every product changes yields a positive outcome.
Although the concept of experimentation has been around for decades, the concept of experiments applied to online digital products, known as A/B Testing, is relatively new. The concept at its core is a simple method but its execution can get a bit challenging especially when you have little to no strategy on what you should be testing and how to get started with it. So let’s discuss an A/B testing framework to get you started.
A/B Testing Process:
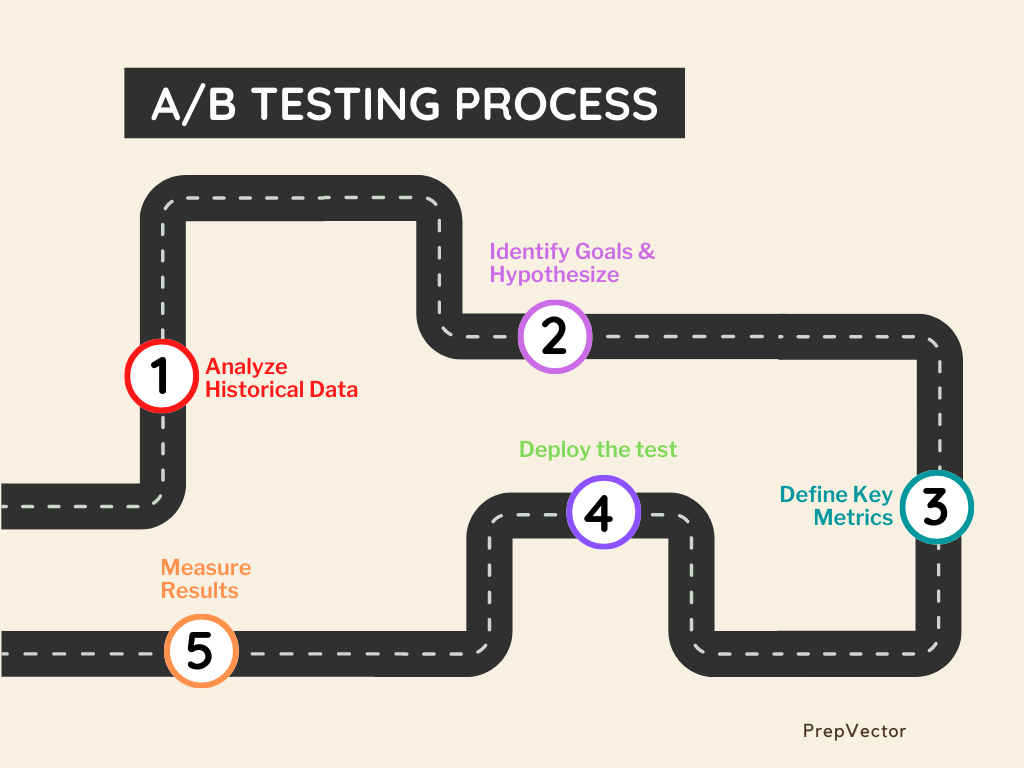
1. Analyze historical data
Deep-diving into the historical data will provide insights on where we can begin optimizing. There can be several ways to do this. The most common way is to analyze the site or app traffic. Look for pages with low conversion rates or pages with high bounce rates. Those pages can be a good starting point to optimize. Another way is to analyze the user journey for the product and analyze the key action steps where the drop-off rate is high. Example - for an eCommerce website, the most basic user funnel would look something like this:
3. Define key metrics
a. Primary metric
b. Secondary/supporting metric
4. Deploy the test
5. Measure results
Deep-diving into the historical data will provide insights on where we can begin optimizing. There can be several ways to do this. The most common way is to analyze the site or app traffic. Look for pages with low conversion rates or pages with high bounce rates. Those pages can be a good starting point to optimize. Another way is to analyze the user journey for the product and analyze the key action steps where the drop-off rate is high. Example - for an eCommerce website, the most basic user funnel would look something like this:
Website visit → user login → search products → click on appropriate product → add product to cart → make payment
Assume that there are a lot of users who click on product descriptions and pages but do not add products to cart. This can result in low conversion rates. In this case, it might be a good idea to start optimizing the product for cart additions.
2. Identify goals and Hypothesize
A/B testing can be used for optimizing user journeys, test different versions of webpages, or test new features before launching them to the entire population. Determine the goal you are optimizing for - it can be user clicks, e-mail sign ups, number of downloads, time spent on page, cart additions, or conversions. Reflect on which of these is most critical and conveys the most relevant information to the business, given the larger business objectives. Based on the identified goal, generate hypothesis that might optimize for that goal.
For the example above, we aim to increase cart additions. One possible hypothesis could be the placement of the ‘add to cart’ button. Assume it is currently at the bottom of the page which makes the user scroll to the end of the page to get to the next step. However, if we move that button up such that it always shows up right next to the product description in the center of the page, that might increase cart additions. In this case, the hypothesis is that placement of the add to cart button at the center of the page increases cart additions.
3. Define key metrics
Metrics quantify the success of an experiment. It helps conclude whether a variant is winning or losing, or if the experiment is inconclusive. Choosing the right metrics help us validate (prove or disprove) your hypothesis and ensure that we are making progress towards our overall business goals. It is important to choose robust and reliable metrics. Every A/B test tracks the following two categories of metrics.
a. Primary metric
The primary metric is usually the most conclusive metric to measure which demonstrated and proves that there is statistical significance in the observation. For instance, the conversion rates. Returning to the earlier illustration, how might the primary metric quantify the A/B test when the size of the bicycle image is changed? - The number of sales
b. Secondary/supporting metric
The secondary metric can have more than one metric to support the hypothesis, in contrast to the primary metric. These metrics are an indication that the outcome is moving in the right direction.
Additionally, you can monitor site speed and other health indicators to make sure the A/B test doesn't affect the internal platform architecture.
4. Deploy the test
After setting the metrics and statistical parameters, make the desired changes to an element of your website or mobile app experience. This might be changing the color of a button, swapping the order of elements on the page, hiding navigation elements, or something entirely custom. For the example we considered above, the two variants will be - Control variant with the ‘add to cart’ button at the bottom of the page (maintaining the status quo) and Test variant with the ‘add to cart’ button at the center of the page next to the product description.
Set randomization strategies to ensure the traffic gets randomly divided between the two variants, ensuring an unbiased experiment. Make sure to QA your experiment to make sure it works as expected.
An important question to ask here is - how long should we run the experiment for? A/B test durations are typically subjective to the product. However, keep in mind that running a test for an extended period of time can render it useless, and running a test for a brief period of time can yield inaccurate results.
The answer to this question is subjective - it depends on a variety of factors like the product itself and the current stage of growth, the feature being tested, variance of the metric and statistical parameters of the test. Having said that, it is recommended to run the experiment for a minimum of two weeks so the weekday vs weekend trends are measurable.
5. Measure results
Once your experiment is complete, it's time to analyze the results. Statistical tests are run to measure the difference in the performance of the two variants and determine whether the difference is statistically significant. If the result is statistically significant, it should be compared against the minimum threshold of the change in metric you expected to see. This minimum change is referred to as the effect size, and helps evaluate if it makes practical and business sense to scale up the change to the entire population. If the experiment is statistically significant and meets the effect size threshold, it's time to celebrate!
Best Practices for A/B Testing:
Now that we understand the end-to-end process for running a standard A/B test, let’s understand what are some of the best practices you can follow to ensure a meaningful experiment.
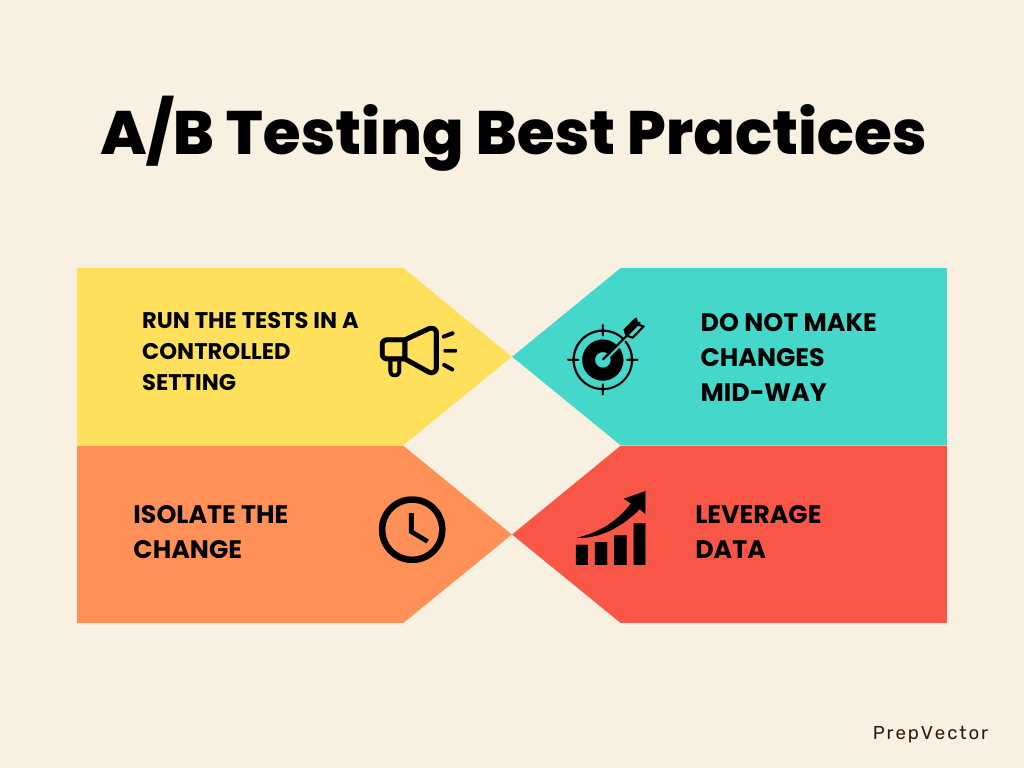
1. Run the tests in a controlled setting
It is best to conduct experiments in a neutral setting to understand the true performance of the product change and its impact on the users. This means isolating the experiment from any external factors. Hence is it advisable to not run experiments during holiday seasons since the user behavior is typically different during the holiday and is not representative of their behavior throughout the year. Sales are high during the Christmas season and can be influenced by external factors. Similarly, make sure no major product launches are scheduled that can impact any experiments during the run.
2. Do not make changes mid-way
Set a clear hypothesis at the start of the experiment. The time to run the experiment is decided upfront and should not be altered during the experiment. Avoid making changes while the test is on. If we interrupt the test before the end of the ideal testing period or introduce new elements that weren’t part of the original hypothesis, our results won’t be reliable.
3. Isolate the change
To set up robust experiments, test one element at a time to isolate the impact of the change. Let’s understand this through an example:
Consider two images - Image 1 for the control group, and Image 2 for the test group.
The page provides users information about the various bicycle options that are available. The key differences between the base and variant are
1. The order of the text
2. The bicycle image
3. The size of the image
It is challenging to prove a hypothesis based on the results of this experiment because the variant in this a/b test has undergone numerous changes. For example, if the variant outperforms the base, we are unable to identify which of the changes mentioned above resulted in an improved performance. Hence, it is a good practice to have a variant with a single change associated with it.
A better variation of the above-mentioned example would be to change one element only and compare the results. It's critical for product managers to understand sometimes small changes can result in significant improvements in product goals.
4. Leverage data
4. Leverage data
Data integrity is a fundamental component of a successful experiment. Leverage historical user data to understand the barriers in the user journey, and then test out changes to your product that reduce those barriers. Then segment your audience to narrow down on specific user subsets on which you want to test.
Designing, executing, and analyzing A/B tests is a complex process with a number of moving parts. But it is a great way to understand your customer and improve your product incrementally. It is a data-driven approach to ensure all product changes being rolled out have a positive impact on customer experience. Understanding the end-to-end process and following the best practices helps design experiments that have a real impact on the users and business goals.

Copyright © 2022
Contact Us!
Got a question? Reach out to us and we will get back to you ASAP!
Thank you!
One more step!
Just a few details before you can download the resources.
Thank you!
Download your resource here
Download your resource here
One more step!
Just a few details before you can download the resources.
Thank you!
Download your resource here
Download your resource here
By submitting this form, you consent to abide by the Privacy Policy outlined by PrepVector.
One more step!
Just a few details before you can download the resources.
Thank you!
Download your resource here
Download your resource here
One more step!
Just a few details before you can download the resources.
Thank you!
Download your resource here
Download your resource here
One more step!
Just a few details before you can download the resources.
Thank you!
Download your resource here
Download your resource here
One more step!
Just a few details before you can download the resources.
Thank you!
Download your resource here
Download your resource here
One more step!
Just a few details before you can download the resources.
Thank you!
Download your resource here
Download your resource here
One more step!
Just a few details before you can download the resources.
Thank you!
Download your resource here
Download your resource here
One more step!
Just a few details before you can download the resources.
Thank you!
Download your resource here
Download your resource here
One more step!
Just a few details before you can download the resources.
Thank you!
Download your resource here
Download your resource here
Access has ended, sorry.
But you can reach out to us at operations@prepvector.com if you need access to the giveaway.
One more step!
Just a few details before you can download the resources.
Thank you!
Download your resource here
Download your resource here
One more step!
Just a few details before you can download the resources.
Thank you!
Download your resource here
Download your resource here
By submitting this form, you consent to abide by the Privacy Policy outlined by PrepVector.
One more step!
Just a few details before you can download the resources.
Thank you!
Download your resource here
Download your resource here
By submitting this form, you consent to abide by the Privacy Policy outlined by PrepVector.
Created with
