
Metrics and Experimentation - Part 1
Manisha Arora & Ishan Goel
The emergence of new web-based business markets has greatly simplified data collection, leading to fascinating transformations in large businesses and investors' approaches. Two decades ago, conversations among investors, fund managers, and other business stakeholders primarily focused on general financial metrics such as revenues, sales, costs, taxes, depreciation, and amortization of assets.
Today, with the substantial increase in data collection convenience, it is common for SaaS entrepreneurs to discuss specific metrics like Daily Active Users and Time Spent Per Session, while investors encourage them to identify the right strategies to steer their business toward the North Star Metric.
Today, with the substantial increase in data collection convenience, it is common for SaaS entrepreneurs to discuss specific metrics like Daily Active Users and Time Spent Per Session, while investors encourage them to identify the right strategies to steer their business toward the North Star Metric.
Introduction
The evolving language of business stakeholders reflects the lens through which contemporary leaders monitor and guide their teams toward their objectives. While the concept of metrics may appear straightforward from the outside, as most metrics are simple ratios that make sense in retrospect through successful case studies, the reality is more complex than it seems.
Metrics that are not meticulously designed can be not only unhelpful but also deceptively harmful, as they can create an illusion of success, obscure real problems, and subtly lead a business toward problems.
Metrics that are not meticulously designed can be not only unhelpful but also deceptively harmful, as they can create an illusion of success, obscure real problems, and subtly lead a business toward problems.
A well-structured set of metrics empowers modern businesses to experiment with various decisions, enabling them to progress efficiently toward their goals. The field of experimentation in online businesses has gained popularity under the name of A/B Testing.
A/B Testing is a quantitative method used to evaluate the effects of feature changes on a product and the value it offers. It examines the impact of a feature change on user experience and establishes a causal relationship between them. Major tech companies conduct thousands of experiments annually. This number continues to grow as organizations recognize the importance of testing before implementing feature changes, ensuring that each change is positive and aligns with broader business objectives. For those interested in learning more about the fundamentals of A/B tests, we recommend reading the article here.
This article is the first in a four-part blog series on metrics.
- Part 1 - Metrics in online experiments
- Part 2 - Types of Metrics
- Part 3 - Characteristics of good metrics
- Part 4 - Case studies of good metric designs
We sincerely hope this blog series offers a comprehensive primer on metrics that helps you develop a strong intuition around the topic and a set of mental models to address them in your work.
What are Metrics?
Our ability to perceive and understand our immediate environment is facilitated by our five basic senses. However, humans have never been confined to merely interacting with our immediate surroundings. Our influence extends across multiple dimensions and encompasses processes far beyond the capabilities of our fundamental senses.
For example, a ruler governing an entire nation does not possess the physical ability to visually observe the entire land. A scientist studying intricate physical processes lacks the senses to measure heat, chemicals, and electricity. A CEO leading a company does not have the time to monitor every minute process occurring throughout the organization.
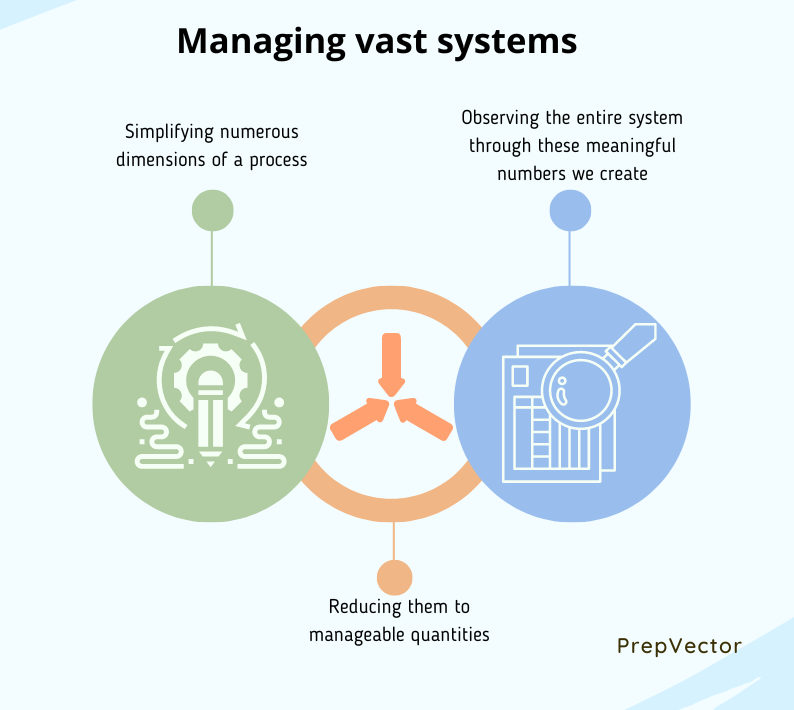
So, how do we, as humans limited by space and time, manage such vast systems?
For example, a ruler governing an entire nation does not possess the physical ability to visually observe the entire land. A scientist studying intricate physical processes lacks the senses to measure heat, chemicals, and electricity. A CEO leading a company does not have the time to monitor every minute process occurring throughout the organization.
So, how do we, as humans limited by space and time, manage such vast systems?
The solution lies in,
- Simplifying the numerous dimensions of a process
- Reducing them to manageable quantities
- Observing the entire system through these meaningful numbers we create.
A ruler might utilize metrics such as population numbers, income levels, and voter demographics to understand their country. Similarly, a scientist employs instruments to track processes of interest, using devices like thermometers, chromatographs, electron microscopes, and voltmeters to measure various phenomena. A CEO, on the other hand, consolidates all processes into a hierarchy of metrics, each feeding into the other, focusing on the top layer known as Key Performance Indicators (KPIs). These various forms of metrics enable humans to comprehend and manage a world much larger than themselves.
The study of metrics is the science of determining how to select appropriate metrics that guide us toward our goals and how to avoid those that conceal critical information from our view.
However, with countless ways to perceive the same things, there are numerous potential metrics that can be used to examine a process. Not all of these provide the most accurate perspective, and not all metrics offer a true representation of the situation.
For example, the total income earned by a specific demographic may not accurately depict the poverty levels in more populous but less affluent regions, whereas per-capita income could be a more suitable metric. Financial analysts have developed a multitude of metrics to assess a company's health in different ways, such as the Price-to-Earnings (P/E) ratio, debt-to-liability ratio, and EBITDA.
The study of metrics is the science of determining how to select appropriate metrics that guide us toward our goals and how to avoid those that conceal critical information from our view.
Why Experimentation?
Rarely do humans just stop observing the world and being content with it. We often seek to intervene, understand what causes what, and then drive whatever we can control according to our wishes. But the world is so deeply randomized that when processes become larger than our immediate reach it is often not straightforward to understand what causes what. While a scientist is then condemned to resolve the statistical randomness in our world, the process of understanding cause and effect is not so simple by design. Often we find other causal patterns interfering with what we are trying to study. It is here that the basis of modern experimentation can be found.
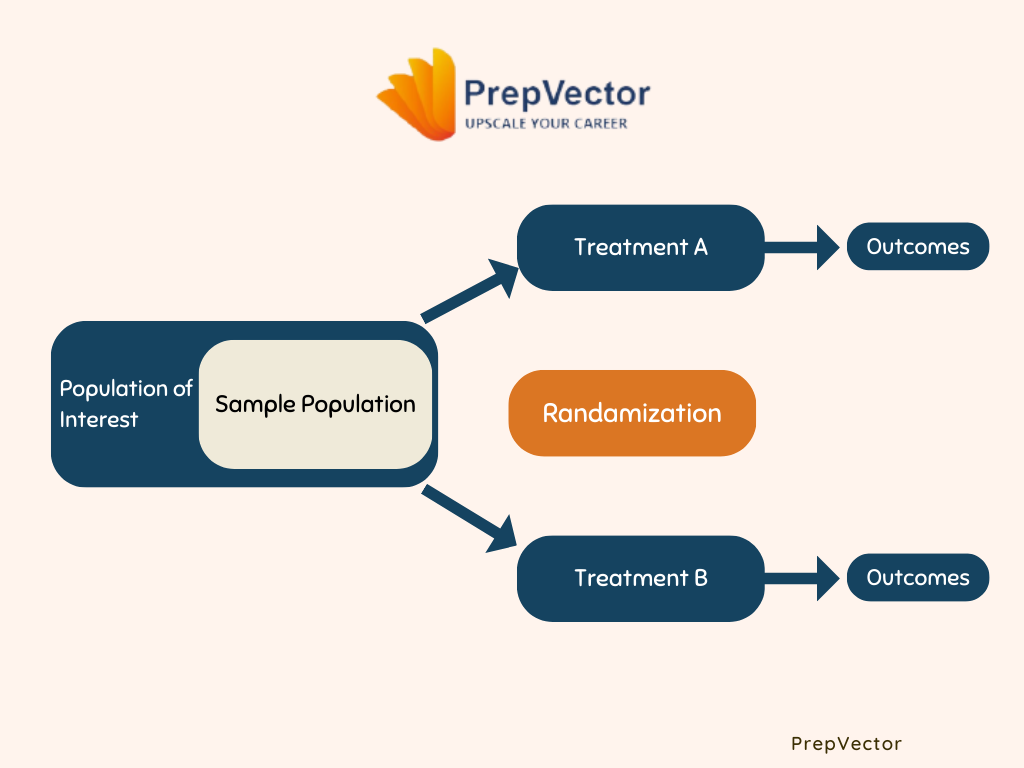
Randomised Control Trials (RCTs) are the gold standard of causal discovery because they theoretically guarantee to isolate the causal link in consideration with all other causal patterns. RCTs were invented by RA Fisher in one of his experiments in the early 20th Century.
Randomised Control Trials (RCTs) are the gold standard of causal discovery because they theoretically guarantee to isolate the causal link in consideration with all other causal patterns. RCTs were invented by RA Fisher in one of his experiments in the early 20th Century.
Fisher wanted to study the impact of various fertilizers on the yield of his crops. He started by neatly splitting his field into two parts and applying the fertilizer to only one. Fisher soon realized that reality was uncontrolled and random. The two halves of his land were different from each other in numerous regards. Both were receiving a different amount of sunlight, had a different soil quality, and also had variations in the water distribution (the confounders). With such vast differences in the underlying properties of the two halves, it was difficult to reliably estimate the impact the fertilizer was having.
To solve the problem, Fisher came up with an ingenious idea and in the process invented Randomised Control Trials (RCT), the holy grail behind modern experimentation. Fisher decided to neutralize the natural randomness in the environment by self-synthesizing randomness in his study. Fisher divided his field into smaller squares and randomly chose the squares which would get the fertilizers and which won't. This randomization ensured that all other factors affecting the yield were evenly divided between the 'fertilizer' and the 'no fertilizer' squares. The difference in the total yield of the two groups now revealed an unbiased estimate of the causal impact that the fertilizer was having on the yield.
And that was the birth of modern randomized experimentation that has majorly governed all scientific experimentation for the past 100 years.
The intervention (fertilizer) and the metric (yield) are the respective cause and effect that experimentation seeks to estimate. Hence, when you experiment with an intervention you are bound to choose a suitable metric that can help you judge if the intervention is making an impact.
Metrics in Modern A/B Testing
Experimentation in the online world of web-based businesses and software-based products has taken the more popular name of A/B Testing. A user starts by creating a variation of his product, chooses a suitable metric to test, and then runs the test on a platform. The platform then randomly divides all visitors into control and variation and applies the relevant statistics to obtain a statistical verdict as to if the variation worked in successfully improving the metric.
3. Case Studies of Good Metric Design: The final part of this blog series takes the reader through the three interesting case studies of good metric design from Microsoft, Amazon, and Bing. The different case studies bring to light the various concepts learned in the blog series and demonstrate how the science of metrics comes in handy in practical real-world scenarios. These real-world stories go on to solidify the intuition around metrics and highlight the importance of case studies in the science of metrics.
The current series of blogs is focused on metrics in the context of A/B testing and we will cover three major areas that will help the user understand the relevant concepts that can help them create better metrics for the purpose of monitoring and experimentation. The three blogs are as follows:
1. Metrics in Modern Tech Companies: The second part of the blog series explains the various aspects of how metrics are arranged in an organization and what kind of different metrics there are. How a driver tree is arranged out of goal metrics, guardrail metrics, and diagnostic metrics is explained finally leading to a discussion on how to develop an effective OEC for experimentation.
2. Characteristics of Good Metrics: The third part of the blog series takes the reader into a deeper discussion on 10 unique properties of good metrics. The reader is taken through the statistical, technical, and practical aspects of metrics which can help one navigate their way through finding effective metrics in their work. The article gives the reader an understanding of why metrics are not hard to create, but good metrics are hard to create.
3. Case Studies of Good Metric Design: The final part of this blog series takes the reader through the three interesting case studies of good metric design from Microsoft, Amazon, and Bing. The different case studies bring to light the various concepts learned in the blog series and demonstrate how the science of metrics comes in handy in practical real-world scenarios. These real-world stories go on to solidify the intuition around metrics and highlight the importance of case studies in the science of metrics.
Conclusion
The study of metrics has a long history, but its importance has never been as pronounced as it is in our current era. With the ease of data collection and the increasing prevalence of abstract, intangible processes in the field of innovation, it has become crucial for individuals to refine their understanding of our rapidly evolving and dynamic world.
In our four-part blog series, we aim to provide a comprehensive view of metrics within the context of A/B testing, offering valuable insights for experimenters and digital marketers embarking on their journey in the realm of metrics. However, the science of metrics is vast, and we are eager to recommend additional resources for those seeking to delve deeper into this fascinating domain.
In our four-part blog series, we aim to provide a comprehensive view of metrics within the context of A/B testing, offering valuable insights for experimenters and digital marketers embarking on their journey in the realm of metrics. However, the science of metrics is vast, and we are eager to recommend additional resources for those seeking to delve deeper into this fascinating domain.
The world of business has been enriched by a plethora of books on metrics and business objectives. For those interested in expanding their perspective, we suggest a few noteworthy titles.
A superb resource for exploring how to translate intangible processes into effective metrics is Douglas Hubbard's How to Measure Anything. Another exceptional book detailing an action-oriented approach to business growth through measurable metrics is John Doerr's Measure What Matters. Furthermore, for insights into how metrics can illuminate a complex world, Ray Dalio'sworks, such as Principles for the Changing World Order, offer a compelling, metric-driven perspective on global economic indicators.
A superb resource for exploring how to translate intangible processes into effective metrics is Douglas Hubbard's How to Measure Anything. Another exceptional book detailing an action-oriented approach to business growth through measurable metrics is John Doerr's Measure What Matters. Furthermore, for insights into how metrics can illuminate a complex world, Ray Dalio'sworks, such as Principles for the Changing World Order, offer a compelling, metric-driven perspective on global economic indicators.
About the Authors
Manish Arora
Lead Data Scientist,
Google
Lead Data Scientist,
Manisha has 10+ years’ experience in Data Science. She is the Experimentation Lead at Google Ads. Manisha is passionate about coaching aspiring Tech Professionals and has coached 300+ data scientists over the past 4 years.
Ishan Goel
Associate Director of Data Science, VWO
Associate Director of Data Science, VWO
Ishan is passionate about research and has published four papers in statistics and data science. His work as a data scientist involves solving algorithmic problems in practical areas like conversion rate optimization, intelligent online tutoring, and GIS analysis.

Copyright © 2022
Contact Us!
Got a question? Reach out to us and we will get back to you ASAP!
Thank you!
One more step!
Just a few details before you can download the resources.
Thank you!
Download your resource here
Download your resource here
One more step!
Just a few details before you can download the resources.
Thank you!
Download your resource here
Download your resource here
By submitting this form, you consent to abide by the Privacy Policy outlined by PrepVector.
One more step!
Just a few details before you can download the resources.
Thank you!
Download your resource here
Download your resource here
One more step!
Just a few details before you can download the resources.
Thank you!
Download your resource here
Download your resource here
One more step!
Just a few details before you can download the resources.
Thank you!
Download your resource here
Download your resource here
One more step!
Just a few details before you can download the resources.
Thank you!
Download your resource here
Download your resource here
One more step!
Just a few details before you can download the resources.
Thank you!
Download your resource here
Download your resource here
One more step!
Just a few details before you can download the resources.
Thank you!
Download your resource here
Download your resource here
One more step!
Just a few details before you can download the resources.
Thank you!
Download your resource here
Download your resource here
One more step!
Just a few details before you can download the resources.
Thank you!
Download your resource here
Download your resource here
Access has ended, sorry.
But you can reach out to us at operations@prepvector.com if you need access to the giveaway.
One more step!
Just a few details before you can download the resources.
Thank you!
Download your resource here
Download your resource here
One more step!
Just a few details before you can download the resources.
Thank you!
Download your resource here
Download your resource here
By submitting this form, you consent to abide by the Privacy Policy outlined by PrepVector.
One more step!
Just a few details before you can download the resources.
Thank you!
Download your resource here
Download your resource here
By submitting this form, you consent to abide by the Privacy Policy outlined by PrepVector.
Created with