Aug 31
/
Shrimanta Satpati & Siddarth R
TheilSen Regression and Estimator
Regression is a type of modeling task where the goal is to predict a numerical value based on input variables. It involves finding the best-fitting line or hyperplane that describes the linear relationship between the inputs and the target numeric value.
Linear Regression, the most widely used ML algorithm, has a major limitation. Outlier influence is pretty biased in linear regression. In fact, even a few outliers can significantly impact its performance.
Outliers are data points that deviate significantly from the general pattern of the data. In the presence of outliers, the line or hyperplane that the regression algorithm fits may be biased, leading to poorer predictive performance. Many times, realistic data, collected in industries and population samples offer this problem.
To address this issue, robust regression algorithms such as HuberRegression, RANSAC regression or TheilSen Regression are used. Robust regression refers to a set of algorithms that are designed to be more resistant to the influence of extreme values in the training data. These algorithms aim to provide more accurate predictions by reducing the impact of outliers on the estimated regression line or hyperplane. TheilSen Regression is the best in terms of the least MAE.
Methodology of TheilSen Regression
TheilSenRegressor, an outlier-robust regression algorithm, can alleviate it in the most efficient way.
It works as follows:
It works as follows:
- Select a subset of data
- Fit a least squares model
- Record model weights
- Repeat
The final weights are the spatial median of all models. Theil Sen regression involves fitting multiple regression models on subsets of the training data and combining the coefficients together in the end.
The estimation of the model is done by calculating the slopes and intercepts of a subpopulation of all possible combinations of p subsample points. If an intercept is fitted, p must be greater than or equal to n_features + 1. The final slope and intercept are then defined as the spatial median of these slopes and intercepts. (Source: scikit-learn documentation)
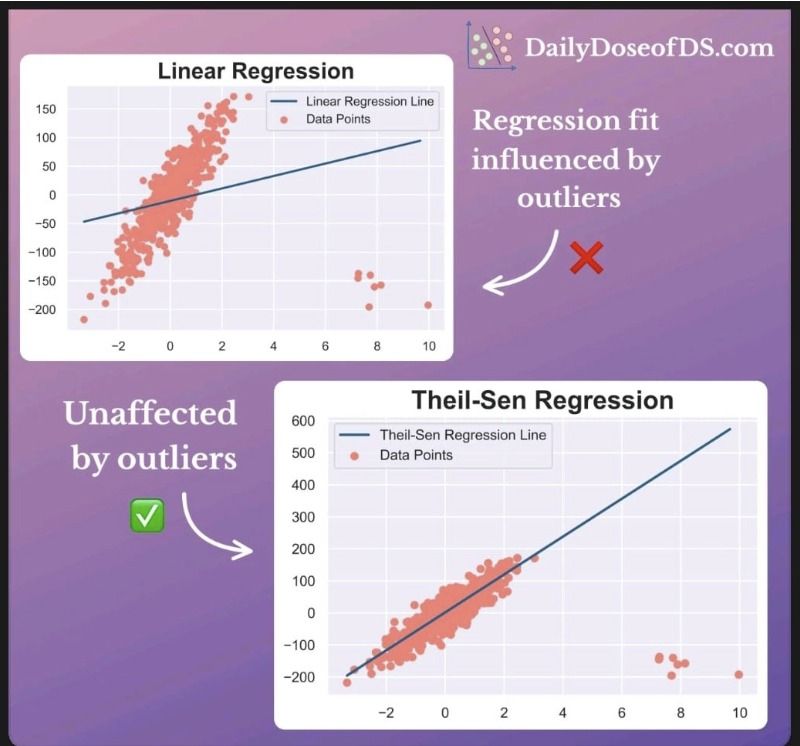
As shown below, while Linear Regression is influenced by outliers, TheilSen Regression isn't.

TheilSen Estimator
The Theil–Sen estimator is a robust nonparametric estimator of the slope of a line in simple linear regression. It is named after Henri Theil and Pranab K. Sen, who published papers on this method in 1950 and 1968 respectively.
It is calculated by finding the median of the slopes of all possible lines that can be drawn through pairs of data points. This makes it more robust to outliers than other estimators, such as the ordinary least squares (OLS) estimator, which can be heavily influenced by outliers. It has a breakdown point of about 29.3% in case of a simple linear regression which means that it can tolerate arbitrary corrupted data (outliers) of up to 29.3% in the two-dimensional case.
The Theil–Sen estimator is also more efficient than other robust estimators, such as the least median of squares (LMS) estimator, in the sense that it has a smaller variance. It is also a good choice when the data is not normally distributed. However, it is not as efficient as the OLS estimator in the absence of outliers.
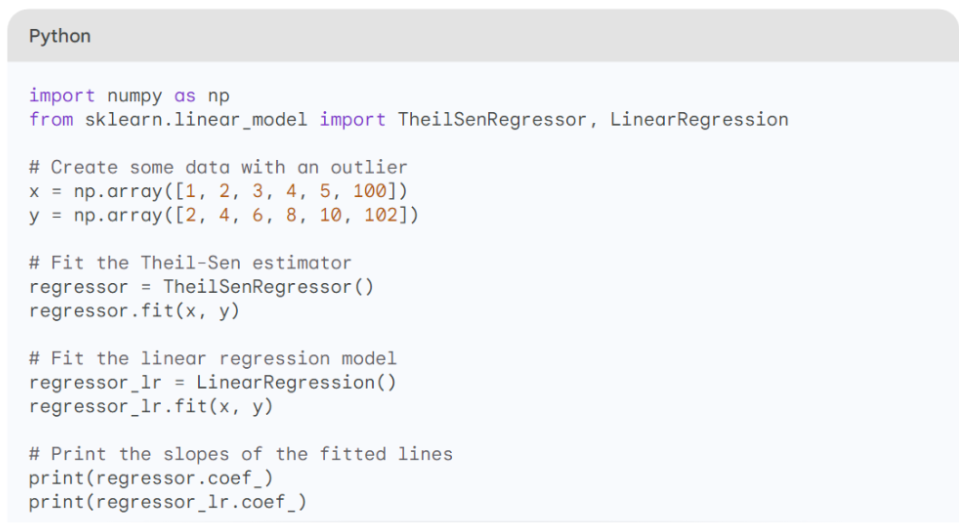
Here is an example of how to calculate the Theil–Sen estimator in Python. The scikit-learn provides an implementation via the TheilSenRegressor class.

This code will print the following output:

As you can see, the slope of the Theil–Sen estimator line is 0.8, while the slope of the linear regression line is 1.6. This is because the Theil–Sen estimator is more robust to outliers than the linear regression estimator. The outlier in this dataset is pulling the linear regression line upwards, but the Theil–Sen estimator is not affected by the outlier. The plots of the Linear Regression and the TheilSenRegression will look like Figure 1.
Some real-world applications
Environmental monitoring – It is used to detect trends in long-term environmental time series data like air pollution, water quality, and climate variables. It is robust to outliers which are common in these datasets.
Geoscience - Geologists use Theil-Sen to estimate trends and slopes in geochemical and geophysical data. For example, analyzing sediment layers or tracking changes in the earth's magnetic field over time.
Anomaly detection - Theil-Sen can identify anomalies and outliers in time series data that deviate from the overall trend, which is useful for monitoring systems.
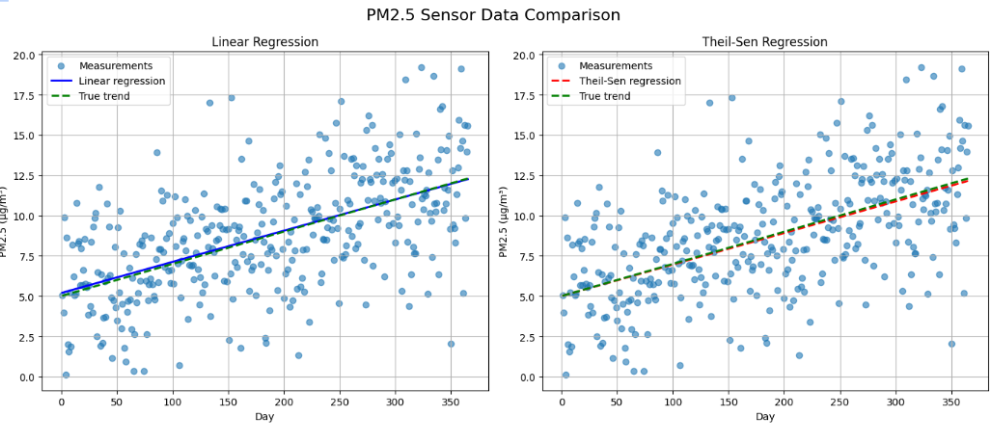
Here is an illustration of the key differences between linear regression and Theil-Sen regression using the air pollution time series example:

True Slope: 0.02
Linear Regression Slope: 0.019 μg/m³ per day
Theil-Sen Regression Slope: 0.020 μg/m³ per day
Synthetic PM2.5 data is generated with a true underlying trend of 0.02 μg/m³ per day, starting at 5 μg/m³ on day 1, and subject to random noise with a standard deviation of 3 μg/m³.
Inferences
Linear Regression: The linear regression slope (0.019 μg/m³ per day) is very close to the true slope (0.02 μg/m³ per day). However, it slightly underestimates the true trend due to the influence of noisy data points.
Theil-Sen Regression: The Theil-Sen regression slope (0.020 μg/m³ per day) is also very close to the true slope. It provides a robust and reliable estimate of the true trend, being less influenced by outliers and noisy data.
Both regression methods are quite accurate in estimating the true underlying trend, but Theil-Sen regression performs slightly better in this specific example because it is less sensitive to the presence of noise and outliers.
About the authors
Shrimanta Satpati
Intern at VisioNxt
Intern at VisioNxt
Shrimanta is an experienced Data Scientist skilled in big data analytics, ML, DL, NLP and Generative AI solutions. He has worked as a Data Science Consultant Trainee in KPMG Digital Lighthouse, India. Passionate about staying up to date with the latest GPT models, LLMs etc. Collaborative team member with excellent communication skills with a flair of technical writing.
Siddarth R
Lead Data Scientist at
Microsoft
Lead Data Scientist at
Microsoft
Siddarth has 19 years experience across Tech and Healthcare. He currently works as Principal Data Science Manager at Microsoft. He is leading a team of data scientists and engineers to deliver strategies for optimization.

Copyright © 2022
Contact Us!
Got a question? Reach out to us and we will get back to you ASAP!
Thank you!
One more step!
Just a few details before you can download the resources.
Thank you!
Download your resource here
Download your resource here
One more step!
Just a few details before you can download the resources.
Thank you!
Download your resource here
Download your resource here
By submitting this form, you consent to abide by the Privacy Policy outlined by PrepVector.
One more step!
Just a few details before you can download the resources.
Thank you!
Download your resource here
Download your resource here
One more step!
Just a few details before you can download the resources.
Thank you!
Download your resource here
Download your resource here
One more step!
Just a few details before you can download the resources.
Thank you!
Download your resource here
Download your resource here
One more step!
Just a few details before you can download the resources.
Thank you!
Download your resource here
Download your resource here
One more step!
Just a few details before you can download the resources.
Thank you!
Download your resource here
Download your resource here
One more step!
Just a few details before you can download the resources.
Thank you!
Download your resource here
Download your resource here
One more step!
Just a few details before you can download the resources.
Thank you!
Download your resource here
Download your resource here
One more step!
Just a few details before you can download the resources.
Thank you!
Download your resource here
Download your resource here
Access has ended, sorry.
But you can reach out to us at operations@prepvector.com if you need access to the giveaway.
One more step!
Just a few details before you can download the resources.
Thank you!
Download your resource here
Download your resource here
One more step!
Just a few details before you can download the resources.
Thank you!
Download your resource here
Download your resource here
By submitting this form, you consent to abide by the Privacy Policy outlined by PrepVector.
One more step!
Just a few details before you can download the resources.
Thank you!
Download your resource here
Download your resource here
By submitting this form, you consent to abide by the Privacy Policy outlined by PrepVector.

