
Aug 21
/
Manisha Arora & Ishan Goel
How to set metrics for an A/B test?
Choosing the right metrics is extremely critical to successful A/B tests. It helps validate (prove or disprove) the set hypothesis and ensure we are making progress towards the overall business goals. Setting the right metrics ensures there is an objective and quantitative method of measuring the experiment and understanding its impact. It also helps distribute that impact to stakeholders in a language that they understand, value, and appreciate.
A well-defined metrics strategy goes beyond the goals of the ground on which the winning variant is decided. It captures various facets of experimentation and assesses the impact on the overall product health and long-term success.
Pursuing metric strategies through experiments enables an entrepreneurial mindset among the employees and drives clear alignment between different teams. It is important to understand how metric strategies drive product strategies and the impact of product changes on various metrics, both positive and negative.
One of the effective ways to have a clear alignment on the interconnection between various metrics is a Driver Tree.
Understanding the Driver Tree:
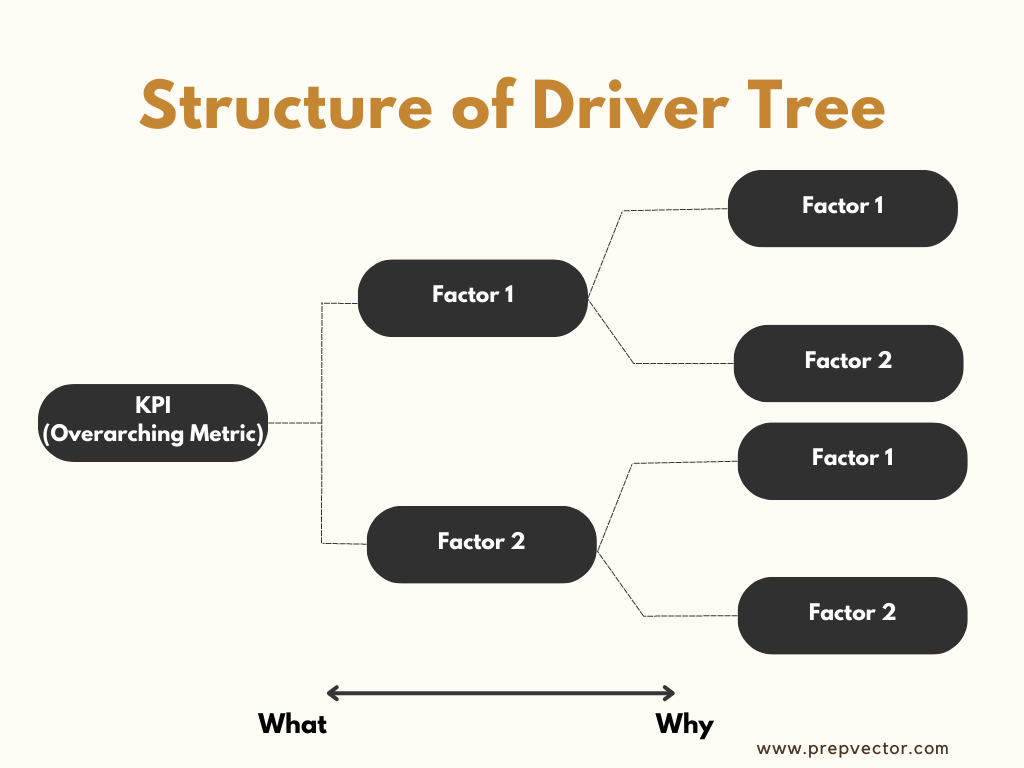
Driver tree is a simple and effective tool to drive growth, find focus, and align teams in an organization. It is a map of how different metrics and levers fit together in an organization. Understanding the driver tree is key to driving a successful metric strategy for the organization that can lead to effective experiments.
A driver tree is a map of different metrics and levers in an organization and how they fit together. It is a great way to visualize the business strategy (what we want to achieve) and the factors that influence or drive that strategy (how we can achieve it). On the left end is the overarching metric we want to move. As we move to the right, we get more granular in terms of how we want to achieve it and what metrics we should move to see an impact on the overarching metric.
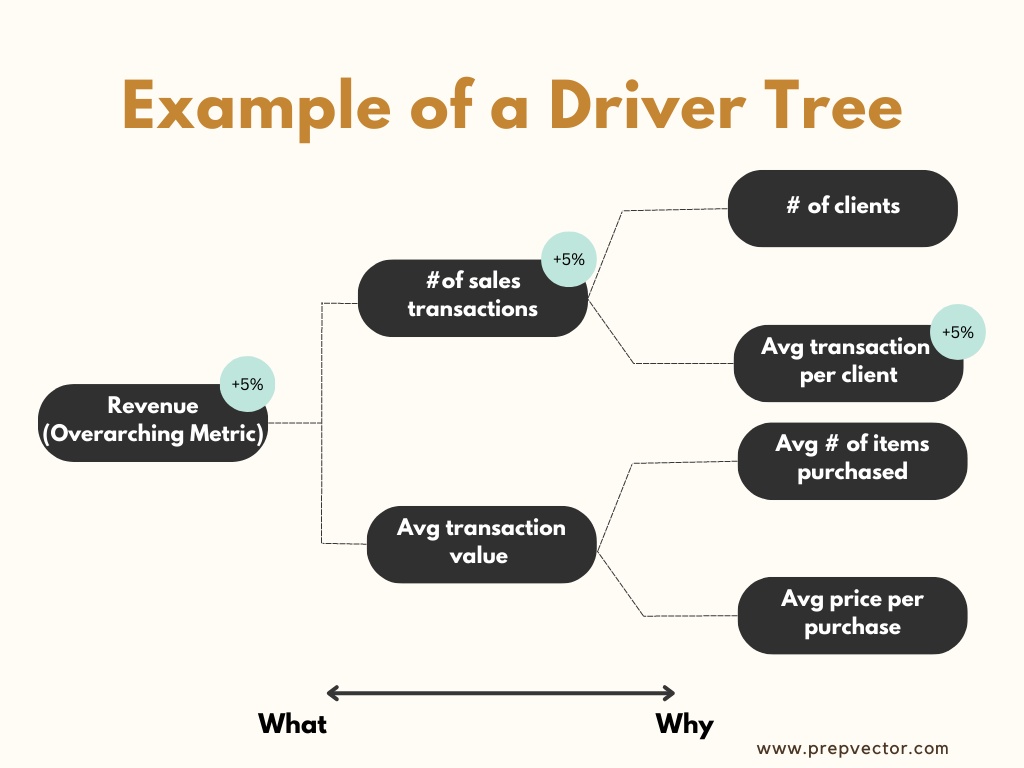
Let’s consider an eCommerce website as an example with an overarching metric of revenue. This revenue can be increased by Level 1 factors that directly influence revenue.
Let us consider # transactions and avg transaction values as the two key influencing factors. These factors can in turn be impacted by Level 2 factors like price, number of users etc.
Building this driver tree can be a great way to understand the metrics that can contribute to your topline metric. This helps various teams align on success metrics of the experiment that can help move the needle. A data-driven product team can use this mapping to identify where strategic initiatives need to be implemented for the highest impact, thus facilitating prioritization.
Types of Metrics
An experiment often needs multiple metrics to quantify the impact on the overall product and user experience. Often, there are three major types of metrics we can set in an experiment:
Goal Metrics
Also known as Primary Metric or Success Metric, it is aligned with the overall company long-term vision and mission. It is a small set of metrics that the company cares about and aims to achieve.
Examples of goal metrics can be revenue, adoption, engagement, or performance. These metrics are typically stable over long periods of time and are lagging in nature. They are also easy to communicate to investors, cross-functional teams, and employees.
However, given the lagging nature of these metrics, they may be difficult to move in short-term through product changes. Hence, goal metrics are typically not suitable for experiments.
Driver Metrics
Instead of using goal metrics, experiments use driver metrics to evaluate success of experiments. These are surrogate or indirect metrics which are leading indicators of product success.
Examples - teams working on app performance or website engagement might not be able to use revenue as their goal metric. But they should be able to use another metric like latency or daily active users, which can contribute in driving higher revenue in the longer-run. It is important to ensure the driver metric chosen directly drives the goal metrics of the organization.
Examples - teams working on app performance or website engagement might not be able to use revenue as their goal metric. But they should be able to use another metric like latency or daily active users, which can contribute in driving higher revenue in the longer-run. It is important to ensure the driver metric chosen directly drives the goal metrics of the organization.
Additionally, if there are multiple teams running experiments, there needs to be an alignment between the driver metrics used by the teams to avoid cannibalization and ensure an overall positive impact on the product and user experience.
Guardrail Metrics
These metrics ensure that any new feature or product change does not impact the company negatively. These metrics act as a sanity check of the experiment. If a guardrail metric is negatively impacted, it can serve as a red flag highlighting either an experiment assumption that has been violated or some aspects of the experiment not going as planned.
Consider an example of an eCommerce app where we want to increase the ‘time spent per user on the page’ by driving better product recommendations. While we want to increase time spent by the user, we do not want to compromise on the latency of the product recommendations. An increase in latency can drive a short-term increase in time spent on the page but can be detrimental to the user experience in the long-run. Hence, the latency is an example of a guardrail metric.
Diagnostic metrics
These metrics help us understand why some important metrics, especially the goal metrics, move or do not move, and how to interpret their movements. Diagnostic metrics are typically not a part of the overall optimization strategy but help diagnose the impact of an experiment. They also confirm the assumptions being made for feature changes.
Example - embedding videos on a web page should increase the page latency. Instead of having an clear directional interpretation, it is more important for a good debugging metric to be sensitive so it moves with the experimental changes.
Most experiments require a combination of different types of metrics to design a robust experiment. Often hundreds of metrics are observed and computed for a test. Only a handful of those are actually used to drive the experiment decision. However, the other metrics are needed to validate our assumptions, assess impact on other features, and ensure there’s no detrimental effect on the users. When all these metrics are used in synergy, we can be confident that we are making the right decisions and our product changes add real value to the users, thus impacting their behavior positively.
Building OEC
Designing an experiment often involves optimizing multiple metrics together. This is where the concept of Overall Evaluation Criteria (OEC) comes into play. An OEC is a combination of various weighted metrics together, which serves as a single metric that can be used for an overall decision-making.
There are two major advantages of building an OEC:
Stability
Single metrics are less stable and easier to game. For example - an experiment on a social media platform increasing the amount of ads shown to the user can increase the revenue, which might appear as a successful experiment. But it can hurt the user engagement and retention in the longer run.
An OEC, on the other hand, is more stable and not easy to game. In the above example, combining revenue along with engagement metrics can prevent a bad change and protect the overall user experience.
Decision-making
A single metric may not be enough to capture the impact of the experiment. Decisions made on one metric only may fail to capture the impact an experiment can have in the long-run. An OEC aligns the organization towards a clear objective, which includes both short-term and long-term outcomes.
How many metrics to add in an OEC?
Having a single metric focused approach for running experiments isn’t recommended. But having too many metrics in an OEC can also make the decision process difficult. This is because metrics can often move in different directions and the overall impact of the experiment might be hard to judge. Hence, combining 3-5 metrics in an OEC is typically a good approach.
Conclusion:
Online experiments are a gold standard for causality and are used by data-driven companies to understand the impact of their products on their users. In this blog, we present how metric strategy ties closely with the design of experiments. We also learnt different types of metrics like goal metrics, driver metrics, guardrail metrics, and diagnostic metrics. Finally, we looked at how multiple metrics can be combined in an OEC to drive decision-making.
In the next blog, we will talk about characteristics of good metrics, and how you can ensure the metrics you choose for an experiment align with the business aspects. Stay tuned!
About the authors
Manish Arora
Lead Data Scientist,
Google
Lead Data Scientist,
Manisha has 10+ years’ experience in Data Science. She is the Experimentation Lead at Google Ads. Manisha is passionate about coaching aspiring Tech Professionals and has coached 300+ data scientists over the past 4 years.
Ishan Goel
Associate Director of Data Science, VWO
Associate Director of Data Science, VWO
Ishan is passionate about research and has published four papers in statistics and data science. His work as a data scientist involves solving algorithmic problems in practical areas like conversion rate optimization, intelligent online tutoring, and GIS analysis.

Copyright © 2022
Contact Us!
Got a question? Reach out to us and we will get back to you ASAP!
Thank you!
One more step!
Just a few details before you can download the resources.
Thank you!
Download your resource here
Download your resource here
One more step!
Just a few details before you can download the resources.
Thank you!
Download your resource here
Download your resource here
By submitting this form, you consent to abide by the Privacy Policy outlined by PrepVector.
One more step!
Just a few details before you can download the resources.
Thank you!
Download your resource here
Download your resource here
One more step!
Just a few details before you can download the resources.
Thank you!
Download your resource here
Download your resource here
One more step!
Just a few details before you can download the resources.
Thank you!
Download your resource here
Download your resource here
One more step!
Just a few details before you can download the resources.
Thank you!
Download your resource here
Download your resource here
One more step!
Just a few details before you can download the resources.
Thank you!
Download your resource here
Download your resource here
One more step!
Just a few details before you can download the resources.
Thank you!
Download your resource here
Download your resource here
One more step!
Just a few details before you can download the resources.
Thank you!
Download your resource here
Download your resource here
One more step!
Just a few details before you can download the resources.
Thank you!
Download your resource here
Download your resource here
Access has ended, sorry.
But you can reach out to us at operations@prepvector.com if you need access to the giveaway.
One more step!
Just a few details before you can download the resources.
Thank you!
Download your resource here
Download your resource here
One more step!
Just a few details before you can download the resources.
Thank you!
Download your resource here
Download your resource here
By submitting this form, you consent to abide by the Privacy Policy outlined by PrepVector.
One more step!
Just a few details before you can download the resources.
Thank you!
Download your resource here
Download your resource here
By submitting this form, you consent to abide by the Privacy Policy outlined by PrepVector.
Created with